How To Analyze Stocks, Use Technical Indicators
Introduction: Investing in the stock market can be both exciting and daunting. With the potential for significant returns, many are drawn to the world of stocks, yet the complexity often leaves new investors unsure of where to start. Whether you’re a beginner or someone looking to refine your skills, understanding how to analyze stocks is crucial. This article will walk you through the essentials of stock analysis, providing insights into both fundamental and technical analysis.
Understanding Fundamental AnalysisMastering Technical AnalysisImplementing Risk ManagementUtilizing Tools and Resources |
|||||
Understanding Fundamental Analysis |
|||||
| Fundamental analysis is the cornerstone of long-term investing. It involves evaluating a company’s financial health, management quality, and market position to determine its intrinsic value. Here’s what you should focus on: | |||||
Earnings Reports |
A company’s earnings report is like a health check-up. It shows how much profit the company made during a specific period. Pay attention to revenue growth, profit margins, and earnings per share (EPS). Consistent growth in these areas often signals a strong company. | ||||
P/E Ratio (Price-to-Earnings Ratio) |
The P/E ratio is a popular metric used to assess whether a stock is overvalued or undervalued compared to its earnings. A high P/E might indicate that the stock is priced higher relative to its earnings, suggesting overvaluation. Conversely, a low P/E could mean the stock is undervalued. | ||||
Dividend Yield |
If you’re interested in income-generating investments, look at the dividend yield. This ratio shows how much a company pays out in dividends each year relative to its stock price. A stable or increasing dividend yield can be a sign of a financially sound company. | ||||
Market News and Trends |
Stay informed about news related to the company and its industry. Market trends, economic indicators, and sector-specific news can have a significant impact on stock prices. For instance, technological advancements or regulatory changes can either boost or hamper a company’s growth prospects. | ||||
Mastering Technical Analysis |
|||||
| While fundamental analysis looks at the intrinsic value, technical analysis focuses on price movements and patterns. It’s particularly useful for short-term traders and those looking to time their entry and exit points. | |||||
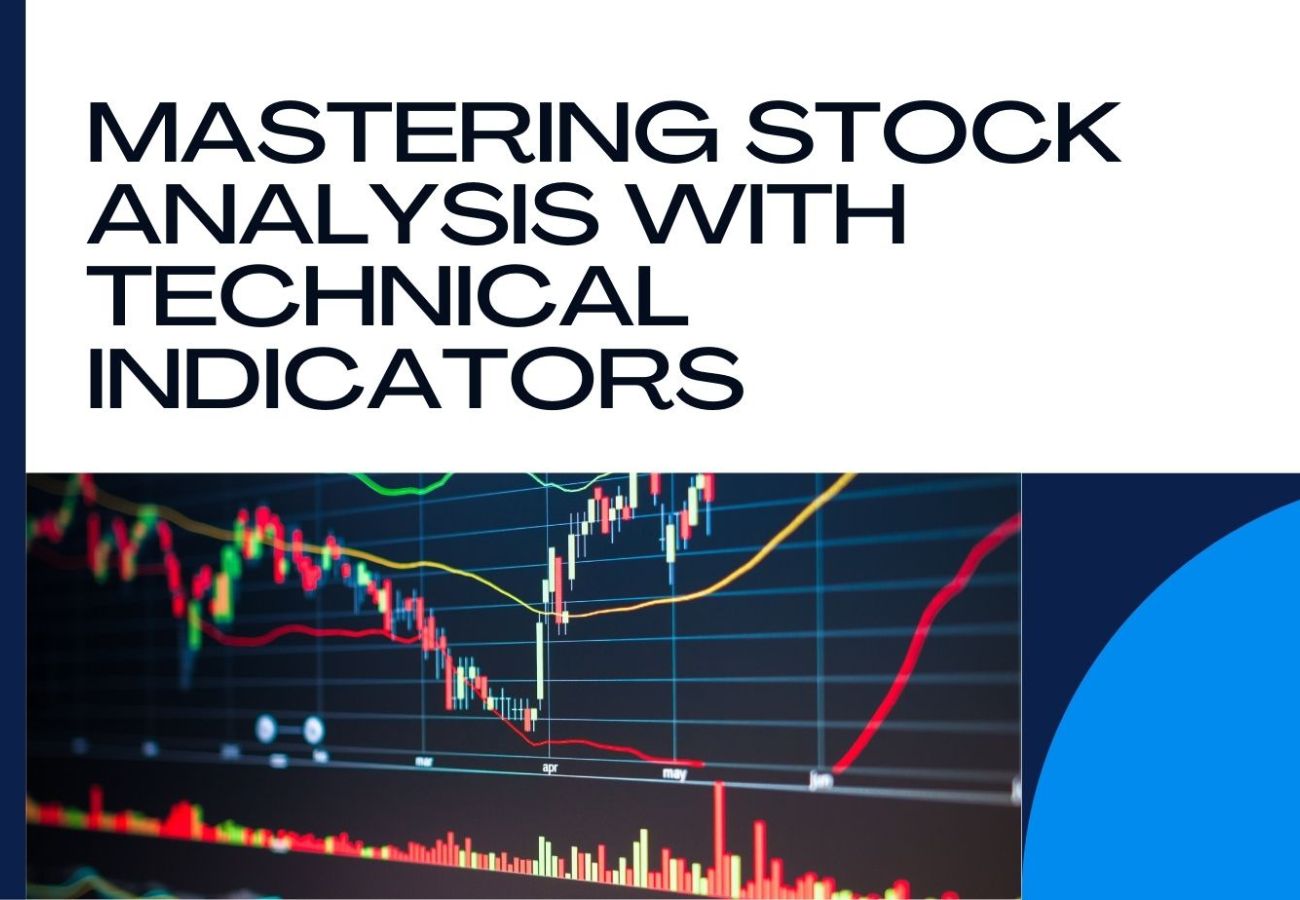
Reading Charts |
Price charts are the foundation of technical analysis. They visualize the stock’s price movements over time. The most common types of charts include line charts, bar charts, and candlestick charts. Candlestick charts, in particular, are favored for their detailed representation of price action. | ||||
Moving Averages (MA) |
Moving averages smooth out price data to help identify trends. The Simple Moving Average (SMA) is calculated by averaging the closing prices over a specified period. The Exponential Moving Average (EMA), on the other hand, gives more weight to recent prices, making it more responsive to new information. Moving averages can help you spot potential buy or sell signals. | ||||
Relative Strength Index (RSI) |
The RSI is a momentum oscillator that measures the speed and change of price movements. It ranges from 0 to 100, with values above 70 indicating that a stock may be overbought, and values below 30 suggesting it might be oversold. RSI is useful for identifying potential reversals in price trends. | ||||
Volume Analysis |
Trading volume refers to the number of shares traded during a given period. High volume on a price increase might indicate strong interest and a potential continuation of the trend. Conversely, low volume on a price rise could signal a lack of conviction, suggesting that the trend might not last. | ||||
Implementing Risk Management |
|||||
| Even the best analysis can’t eliminate risk. That’s why it’s essential to have a risk management strategy in place. | |||||
Stop-Loss Orders |
A stop-loss order is an automatic order to sell a stock when it reaches a certain price. This tool helps limit potential losses by ensuring you don’t hold onto a stock that’s declining in value. | ||||
Diversification |
Diversifying your portfolio across different sectors, industries, and asset classes can reduce risk. If one investment performs poorly, others may perform well, balancing your overall returns. | ||||
Position Sizing |
Position sizing refers to determining how much of your portfolio to invest in a particular stock. Consider your risk tolerance and the stock’s volatility when deciding your position size. This strategy helps manage risk and prevent significant losses. | ||||
Utilizing Tools and Resources |
|||||
| Investing without the right tools is like navigating without a map. Thankfully, there are plenty of resources available to help you analyze stocks more effectively: | |||||
Stock Screeners |
Stock screeners are online tools that allow you to filter stocks based on specific criteria, such as market capitalization, P/E ratio, or dividend yield. Websites like Yahoo Finance, Finviz, and TradingView offer robust screeners that can help you find stocks that meet your investment criteria. | ||||
Financial News |
Staying updated with financial news is crucial. Platforms like Bloomberg, CNBC, and Reuters provide real-time news and analysis that can help you stay informed about market trends and individual stocks. | ||||
Technical Analysis Software |
For those interested in technical analysis, software like MetaTrader, Thinkorswim, or TradingView offers comprehensive charting tools and technical indicators. These platforms allow you to visualize trends, set up alerts, and backtest strategies. | ||||
Continual Learning |
|||||
| The stock market is ever-evolving, and continuous learning is key to staying ahead. Here are some ways to enhance your knowledge: | |||||
Books |
Online Courses |
||||
| Consider reading classic investment books like “The Intelligent Investor” by Benjamin Graham or “Technical Analysis of the Financial Markets” by John Murphy. These books provide deep insights into both fundamental and technical analysis. | There are numerous online platforms like Coursera, Udemy, and Investopedia that offer courses on stock analysis, investing strategies, and financial markets. These courses range from beginner to advanced levels, catering to all types of investors. | ||||
Conclusion
Analyzing stocks effectively requires a blend of both fundamental and technical analysis. While fundamental analysis helps you understand the company’s value, technical analysis aids in timing your trades. Coupled with sound risk management practices and continuous learning, these strategies can help you make more informed and confident investment decisions. Remember, the stock market is not about getting rich overnight, but about making calculated decisions that lead to steady growth over time.
The Basics of Stock Market Investing |
1 thought on “How To Analyze Stocks, Use Technical Indicators”